HRV: the discreet thermometer of your nervous system
TL;DR
Heart rate variability is not an app metric. It is a direct window into the balance of the autonomic nervous system — and persistent drops precede disease, overtraining, and burnout by weeks or months.
Felipe is 41. Chief financial officer of a multinational, an amateur triathlete, has used Oura for nearly three years. He came to our office because he had begun to lose form for no apparent reason. I train the same as two years ago, sleep the same seven hours, but I'm wrecked. What brought him in was not an abnormal lab — it was a curve in the app. My HRV has dropped by half over the last five months. From an average of 64 milliseconds to 32. And the trend keeps falling.
The drop in HRV was the first measurable sign of something he could not yet describe in words — exactly the kind of signal we look for in our clinical practice at Plenya, before it becomes a diagnosis.
What that number is measuring
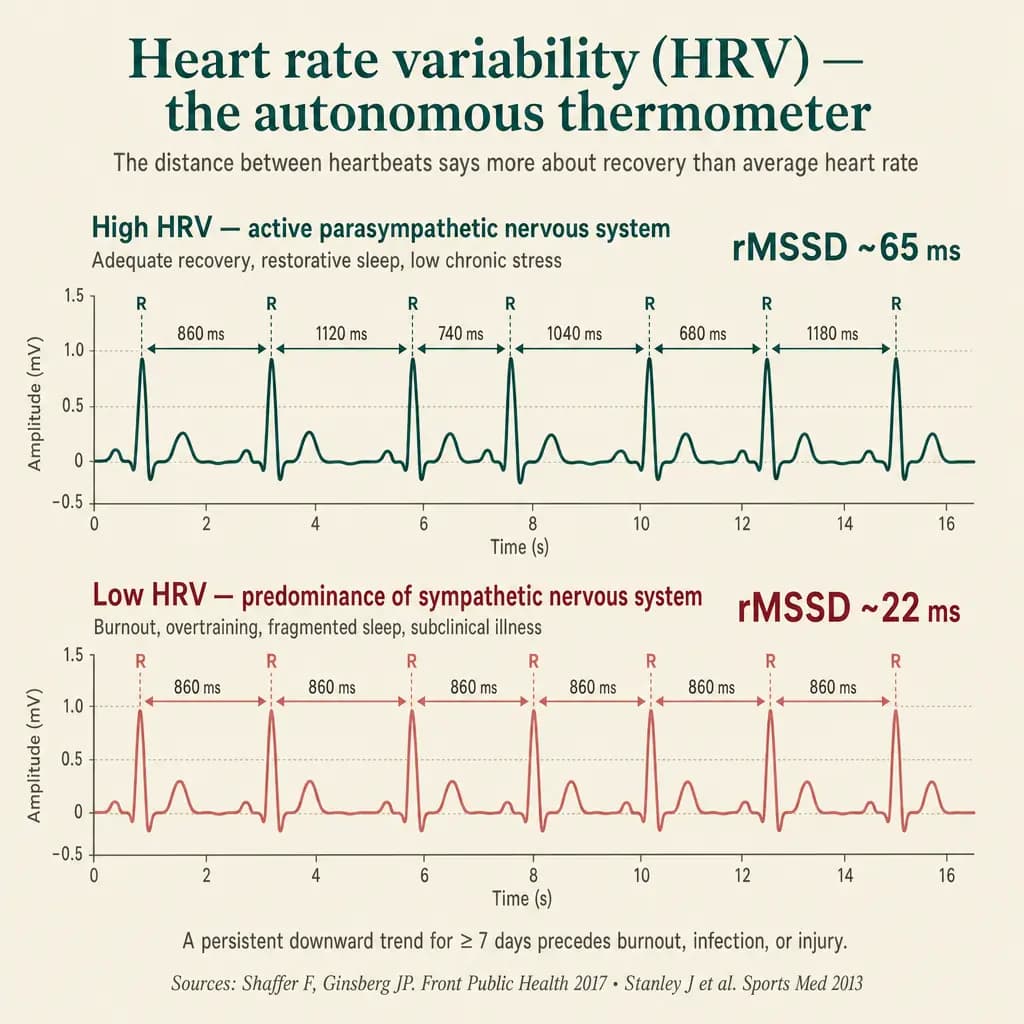
Heart rate variability — HRV — is the measure of variation in time between two consecutive heartbeats. If your heart beats 60 times per minute, that does not mean each beat occurred exactly one second after the previous one. In a healthy person, the interval between beats varies: 980 ms, 1020 ms, 950 ms, 1010 ms. That variation is HRV.
It seems counterintuitive, but more variation is better. A healthy person's heart is responsive: it speeds up when you inhale (because the vagus nerve momentarily lifts its foot off the brake) and slows when you exhale (because the vagus brakes again). The effect is called respiratory sinus arrhythmia. The more pronounced it is, the higher the parasympathetic tone — the branch of the autonomic nervous system responsible for resting, digesting, recovering.
The heart of someone stressed, ill, or exhausted loses that elasticity. It beats more regularly, more "rigidly." The intervals between beats become uniform. HRV falls.
The clinical reading our team uses comes from international consensus — the 1996 technical document from the joint Task Force of the European Society of Cardiology and the North American Society of Pacing and Electrophysiology, published in Circulation, is still the principal reference. It establishes the metrics (RMSSD, SDNN, pNN50, LF/HF) and the physiologic interpretation behind every modern wearable.
The Shaffer and Ginsberg review, published in 2017 in Frontiers in Public Health, organizes those metrics for the non-specialist reader and establishes reference values. For RMSSD — the metric most modern wearables report as "HRV" — healthy adults at rest typically sit between 25 and 75 ms, with averages around 40–60 ms. Trained athletes can reach 80–100 ms. People in chronic stress, with dysautonomia, or with ongoing disease sit below 20 ms.
Why this matters for health
HRV is not technological vanity. The cardiovascular literature has treated it as a risk marker for decades.
The Thayer, Yamamoto, and Brosschot review published in 2010 in the International Journal of Cardiology synthesizes data showing that reduced HRV is an independent risk factor for cardiovascular and all-cause mortality, and is associated with virtually every modifiable risk factor (hypertension, obesity, sedentary behavior, psychosocial stress). The central mechanism is autonomic imbalance — chronic sympathetic predominance over parasympathetic — which precedes and accompanies systemic inflammation, insulin resistance, and endothelial dysfunction.
After a heart attack, reduced HRV predicts mortality independently of ejection fraction. In diabetic patients, low HRV predicts autonomic neuropathy before it becomes clinically evident. In healthy young adults, higher HRV predicts lower incidence of cardiovascular events over decades.
This does not mean mass HRV screening saves lives — there is no randomized clinical trial demonstrating that causal chain. But our team's reading is that the number, interpreted in trend and in context, gives real information about the autonomic state of whoever is wearing the ring or the watch.
What raises HRV, what lowers it
HRV is highly sensitive and highly individual. Today's number only makes sense against your baseline — your 14- to 60-day moving average.
Generally raise HRV:
- Prolonged, regular deep sleep.
- Low-intensity aerobic training (Zone 2) done consistently.
- Slow, diaphragmatic breathing (5 to 6 cycles per minute, for 5 to 10 minutes).
- Morning sun exposure, anti-inflammatory eating, adequate hydration.
- Active recovery after well-dosed training loads.
Lower HRV:
- Sleep deprivation, even one night.
- Alcohol — the effect is dose-dependent and disproportionate to perception (two glasses at dinner drop HRV more than vigorous training in the next hour).
- Recent intense training (a physiologic 24–48h drop, which is normal and necessary).
- Recent intense training combined with poor sleep — that is the overtraining signal.
- Disease in incubation (two to three days before flu or viral infection symptoms).
- Acute or chronic psychosocial stress.
- Heavy late-evening meal, especially with alcohol.
The Plews and colleagues review, published in 2013 in Sports Medicine, is particularly relevant for the athletes we follow: in endurance training, systematic HRV monitoring allows us to distinguish positive adaptation (stable or rising HRV under increasing load) from overtraining (persistently falling HRV despite stable or reduced load). The practical rule that emerged from the literature, and that we apply through The ACTS Method (Activity, Alimentation & Smart Adjuncts · Clinical Optimization · Tending Mind, Body & Bonds · Sleep, Rhythm & Recovery): persistent drops above 20% of baseline lasting more than 7 to 14 days justify reassessing load, sleep, and stress.
How to read it in real life
Modern wearables — Oura, Whoop, Garmin, Polar, Apple Watch — measure HRV during sleep, in a standardized nighttime window, using RMSSD or a derived metric. The nighttime measure is more reliable than spot measures during the day because it eliminates variables (posture, recent meal, immediate stress).
The useful reading our team makes:
- 30-day trend — that is what matters, not the number on one night. A 15 ms drop the night after a marathon is normal. An average drop of 15 ms over 6 weeks deserves attention.
- Comparison with yourself — not with a generic age table or the gym neighbor. HRV is highly individual; your 35 ms may be your healthy baseline.
- Combined with other signals — resting heart rate (which usually rises when HRV falls), subjective sleep quality, morning energy, libido, motivation to train. If four of those drop together, HRV becomes a confirmer, not an isolated alarm.
What we did with Felipe
Felipe did not have an abnormal blood test. TSH normal, testosterone in the normal-low range, ferritin 95, hs-CRP 2.1 (borderline). But the set told a clear story to our team: workload had grown over the last six months, sleeping in inconsistent hours (1 a.m.–7 a.m. on weekdays, 11 p.m.–9 a.m. on weekends), drinking two glasses of wine five nights a week, intense training maintained without adjustment, stopped going out with friends.
It was not disease. It was excessive dose of everything, sustained for three years, and the autonomic system finally signaled loud and clear.
Plan: training load reduction of 30% for 8 weeks, alcohol restricted to two nights per week, consistent sleep schedule at a fixed time, 10 minutes of slow breathing before bed, mindfulness practice via app for 10 minutes daily.
In 10 weeks, average HRV climbed back from 32 to 51 ms (still below the previous baseline, but rising). Subjective energy returned. Workouts stopped "hurting the next day" as before. Resting heart rate fell from 58 to 49.
The reading the Continuum makes
In Continuum Plenya, we treat wearable data neither as a toy nor ignore it as noise. When relevant, it enters the patient's score alongside blood, measured sleep, body composition, and the clinical reading. Our exercise physiologist adjusts training periodization, our psychologist addresses the trigger of chronic stress, our physician investigates what needs investigation.
HRV does not replace the consultation. But in our team's hands, it is one of the few numbers on your wrist that tells the truth your mouth has not yet said.
References
- Task Force of the European Society of Cardiology and the North American Society of Pacing and Electrophysiology. Heart rate variability: standards of measurement, physiological interpretation, and clinical use. Circulation, 1996;93(5):1043-1065.
- Shaffer F, Ginsberg JP. An Overview of Heart Rate Variability Metrics and Norms. Front Public Health, 2017;5:258.
- Thayer JF, Yamamoto SS, Brosschot JF. The relationship of autonomic imbalance, heart rate variability and cardiovascular disease risk factors. Int J Cardiol, 2010;141(2):122-131.
- Plews DJ, Laursen PB, Stanley J, Kilding AE, Buchheit M. Training adaptation and heart rate variability in elite endurance athletes: opening the door to effective monitoring. Sports Med, 2013;43(9):773-781.