Normal versus optimal — the interval the lab does not print

TL;DR
The reference range on a lab report was built to detect disease, not to sustain health. The distance between the two is wide, and a great deal depends on it.
The lab's “normal” range was not built with you in mind. It was built from the population — and from that population the obvious sick were removed, but the pre-sick were not.
The result, as our team observes again and again: “normal” spans a wide window that contains people on a trajectory toward disease, healthy people, and people in optimal condition all at once. For screening established disease, that works. For building longevity, it does not.
The difference between a fasting insulin of 8 and a fasting insulin of 25 is not gradation — it is a chasm. Both are “normal” on the report. One is compatible with full metabolic health; the other is a few years away from clinical insulin resistance, hepatic steatosis, and metabolic syndrome. Petersen and colleagues, in the NEJM in 2004, showed that the offspring of type-2 diabetics — with fasting insulin still inside the “normal” range — already exhibit detectable intramuscular mitochondrial dysfunction. The metabolic damage precedes the diagnosis by decades.
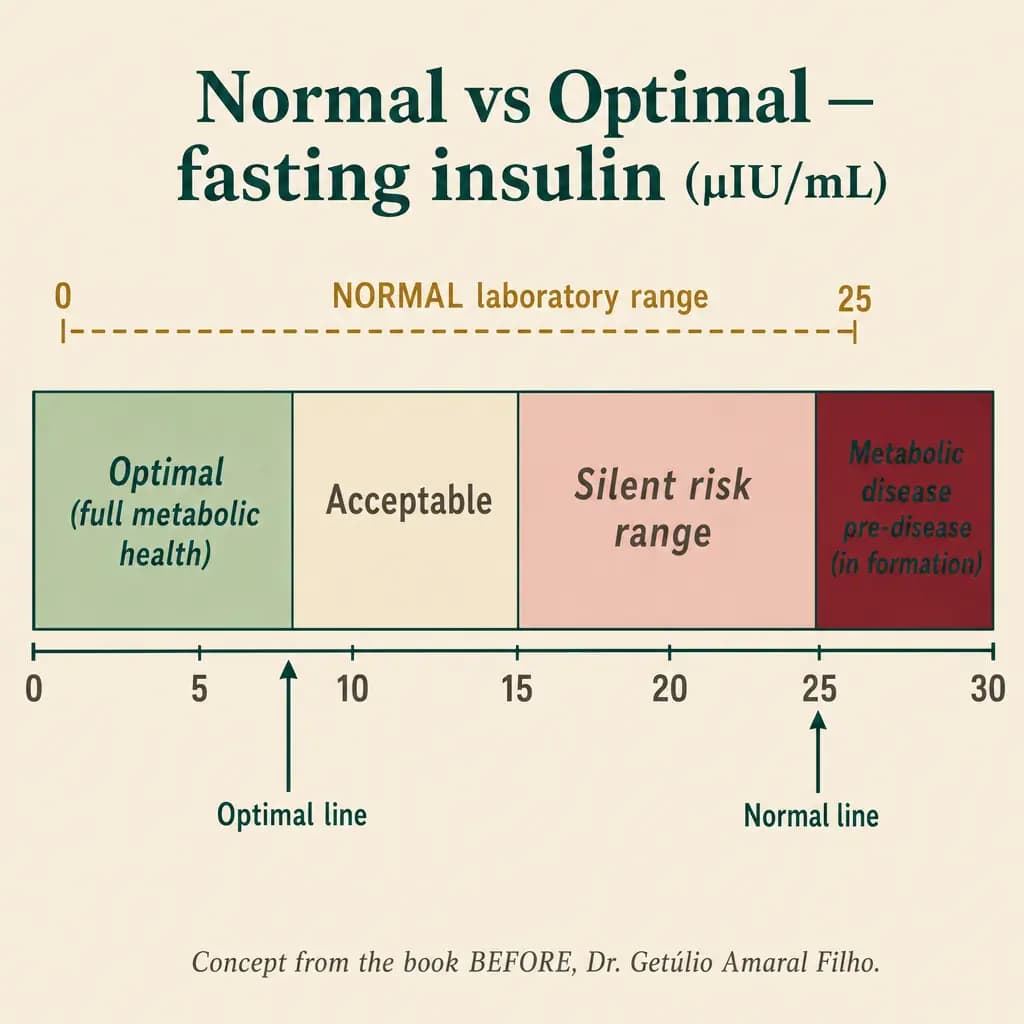
The same applies to ApoB, hs-CRP, homocysteine, vitamin D, ferritin, and the TG/HDL ratio. In each, there is a “normal” band and an “optimal” band — and the distance between them is where the silent window lives. Sniderman and colleagues in 2019 (JAMA Cardiology) propose ApoB cutoffs much more conservative than those used in average Brazilian practice; Ridker (NEJM 2017), in the CANTOS trial, showed that treating subclinical inflammation (hs-CRP) reduces hard endpoints even when LDL is already controlled.
The consolidation appears in the American Heart Association statement on cardiovascular-kidney-metabolic health (Ndumele 2023): the operational thresholds for real prevention differ from the classical cutoffs used to diagnose established disease.
In our clinical practice at Plenya, through The ACTS Method (Activity, Alimentation & Smart Adjuncts · Clinical Optimization · Tending Mind, Body & Bonds · Sleep, Rhythm & Recovery) we apply, re-reading labs through the lens of optimal does not require new or expensive equipment. It requires a different question. The reading is the same. The question is different.
Excerpt from Chapter 4 of the book BEFORE — The silent window between normal and optimal — a decade where health is decided.
References
- Sniderman AD, Thanassoulis G, Glavinovic T, et al. "Apolipoprotein B Particles and Cardiovascular Disease: A Narrative Review." JAMA Cardiol. 2019;4(12):1287-1295.
- Petersen KF, Dufour S, Befroy D, Garcia R, Shulman GI. "Impaired mitochondrial activity in the insulin-resistant offspring of patients with type 2 diabetes." N Engl J Med. 2004;350(7):664-671.
- Ridker PM, Everett BM, Thuren T, et al. "Antiinflammatory Therapy with Canakinumab for Atherosclerotic Disease." N Engl J Med. 2017;377(12):1119-1131.
- Ndumele CE, Rangaswami J, Chow SL, et al. "Cardiovascular-Kidney-Metabolic Health: A Presidential Advisory From the American Heart Association." Circulation. 2023;148(20):1606-1635.
- Amaral Filho GJM. "ANTES — A Janela Silenciosa entre o Normal e o Ótimo." 2026, ISBN 978-65-02-06742-0.